Value at Risk#
import chainladder as cl
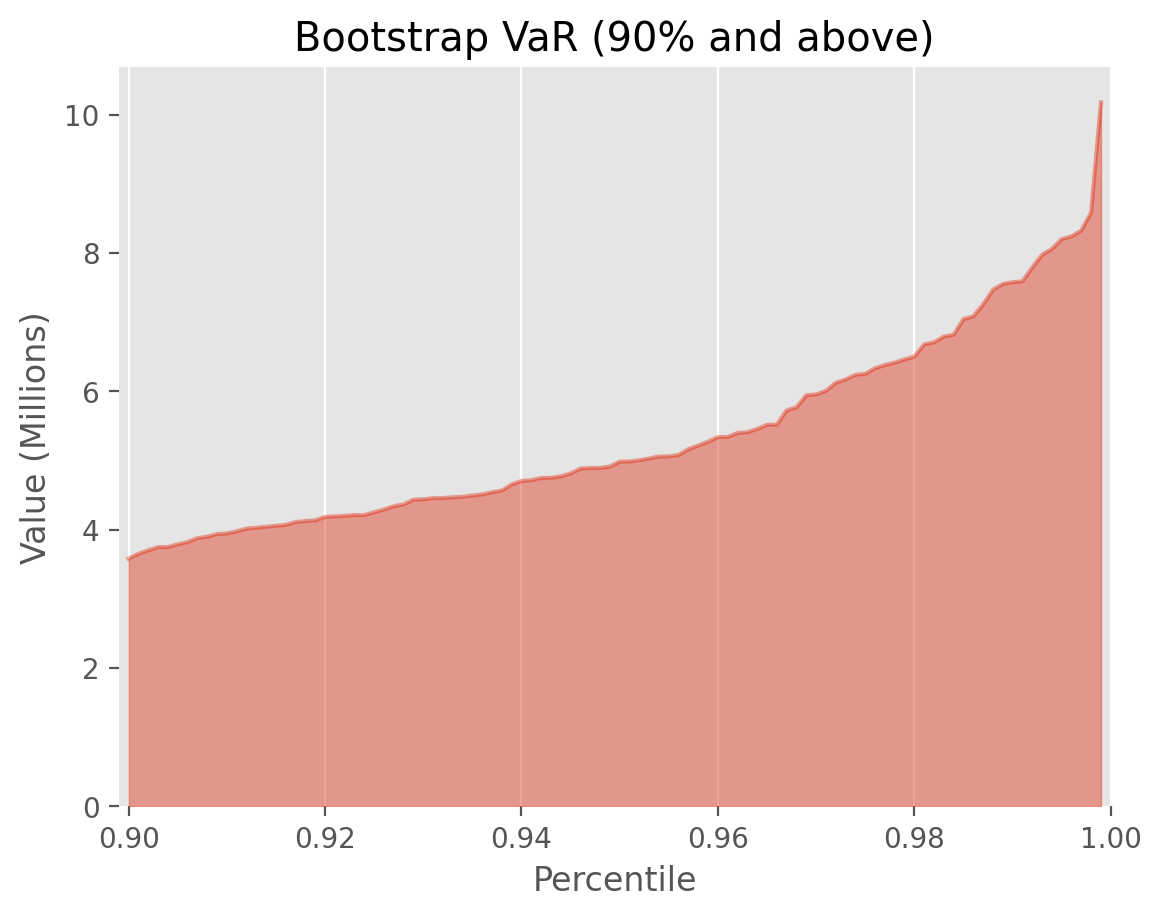
This example uses the BootstrapODPSample to simulate new triangles that
are then used to simulate an IBNR distribution from which we can do
Value at Risk percentile lookups.
# Load triangle
triangle = cl.load_sample('genins')

# Create 1000 bootstrap samples of the triangle
resampled_triangles = cl.BootstrapODPSample(random_state=42).fit_transform(triangle)

# Create 1000 IBNR estimates
sim_ibnr = cl.Chainladder().fit(resampled_triangles).ibnr_.sum('origin')

# X - mu
sim_ibnr = (sim_ibnr - sim_ibnr.mean()).to_frame().sort_values()
Show code cell source
import matplotlib.pyplot as plt
plt.style.use('ggplot')
%config InlineBackend.figure_format = 'retina'

# Plot data
fig, ax = plt.subplots()
sim_ibnr.index = [item/1000 for item in range(1000)]
(sim_ibnr/1e6).loc[0.90:].plot(kind='area', alpha=0.5,
    title='Bootstrap VaR (90% and above)', ax=ax).set(
    xlabel='Percentile', xlim=(0.899, 1.0), ylabel='Value (Millions)');
ax.grid(axis='y')
for spine in ax.spines:
    ax.spines[spine].set_visible(False)