DevelopmentConstant Callable#
import chainladder as cl
import pandas as pd
DevelopmentConstant takes a dictionary of development factors and stores them
in a development estimator. This example demonstrates how a function can be
passed into DevelopmentConstant rather than a static dictionary of patterns.
The function should return development patterns for each element of the Triangle’s
index. When passing a function to the estimator, it behaves as if calling the
pandas apply method on the Triangle’s index.
# Sample Data
agway = cl.load_sample('clrd').loc['Agway Ins Co', 'CumPaidLoss']

def paid_cdfs(x):
    """ A function that returns different CDFs depending on a specified LOB """
    cdfs = {
    'comauto': [3.832, 1.874, 1.386, 1.181, 1.085, 1.043, 1.022, 1.013, 1.007, 1],
    'medmal': [24.168, 4.127, 2.103, 1.528, 1.275, 1.161, 1.088, 1.047, 1.018, 1],
    'othliab': [10.887, 3.416, 1.957, 1.433, 1.231, 1.119, 1.06, 1.031, 1.011, 1],
    'ppauto': [2.559, 1.417, 1.181, 1.084, 1.04, 1.019, 1.009, 1.004, 1.001, 1],
    'prodliab': [13.703, 5.613, 2.92, 1.765, 1.385, 1.177, 1.072, 1.034, 1.008, 1],
    'wkcomp': [4.106, 1.865, 1.418, 1.234, 1.141, 1.09, 1.056, 1.03, 1.01, 1]}
    patterns = pd.DataFrame(cdfs, index=range(12, 132, 12)).T
    return patterns.loc[x.loc['LOB']].to_dict()

# If it works with pandas apply on the triangle index...
agway.index.apply(paid_cdfs, axis=1)
# ... then it will work in DevelopmentConstant
model = cl.DevelopmentConstant(patterns=paid_cdfs, callable_axis=1, style='cdf')

model.fit(agway)
DevelopmentConstant(callable_axis=1,
                    patterns=<function paid_cdfs at 0x7fbc91fad080>,
                    style='cdf')
In a Jupyter environment, please rerun this cell to show the HTML representation or trust the notebook. On GitHub, the HTML representation is unable to render, please try loading this page with nbviewer.org.
DevelopmentConstant(callable_axis=1,
                    patterns=<function paid_cdfs at 0x7fbc91fad080>,
                    style='cdf')
Show code cell source
import matplotlib.pyplot as plt
plt.style.use('ggplot')
%config InlineBackend.figure_format = 'retina'
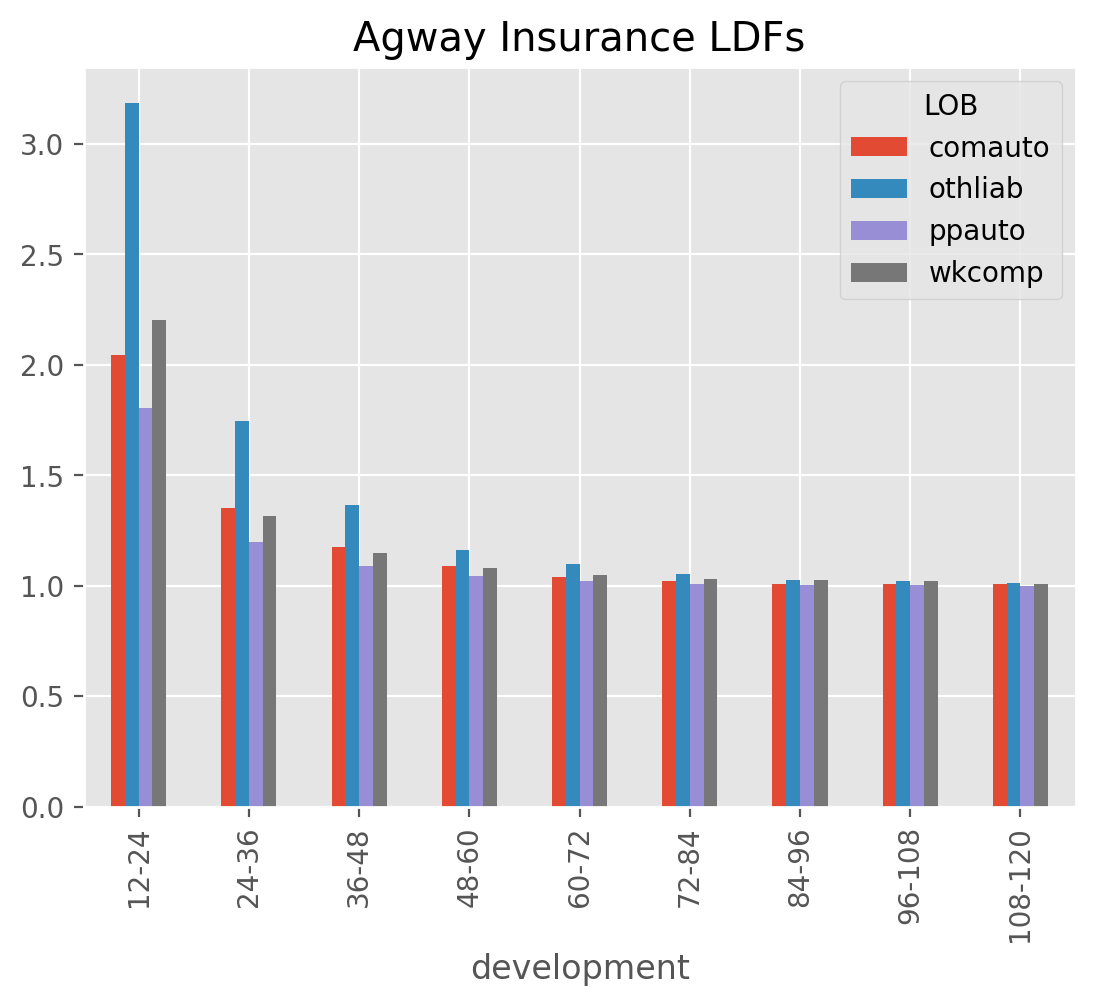
ax = model.ldf_.T.plot(kind='bar', title='Agway Insurance LDFs');