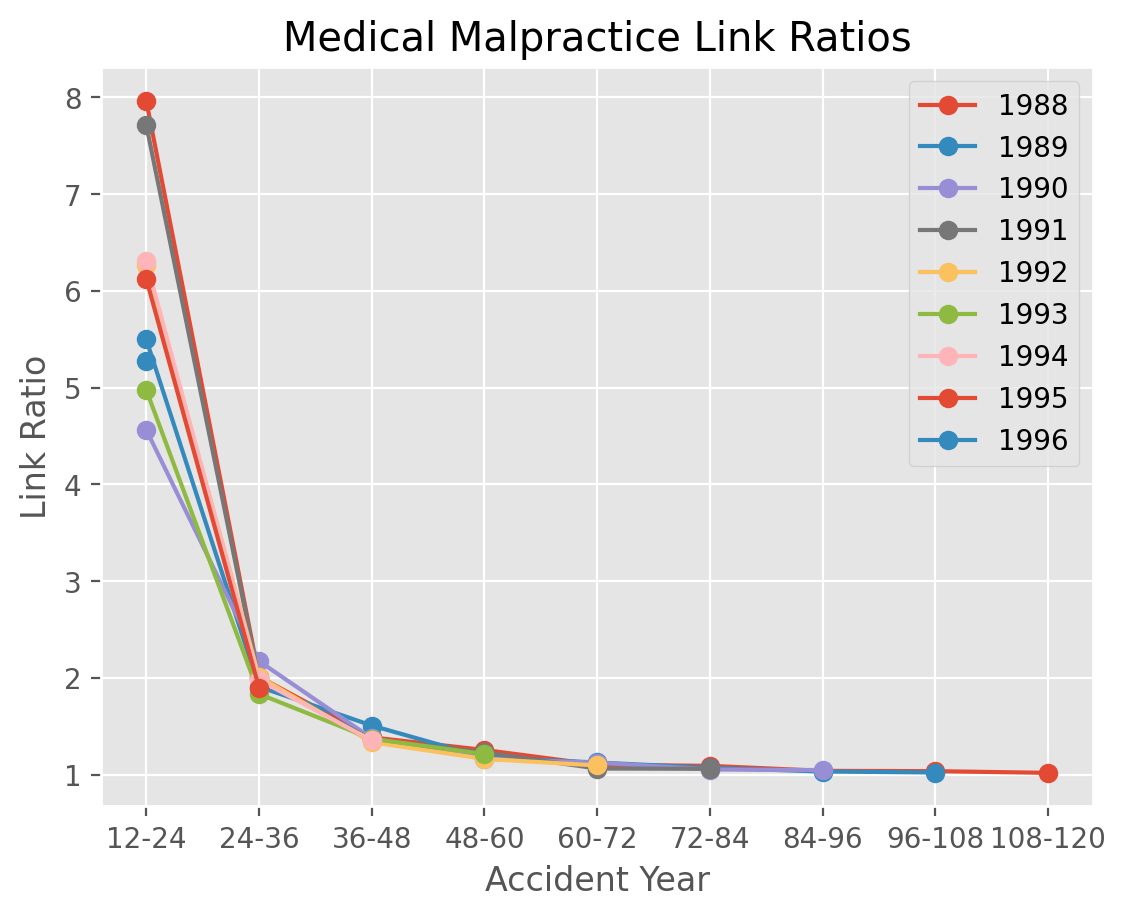
Triangle Slicing
This example demonstrates the familiarity of the pandas API applied to a
:class:Triangle instance.
|
Triangle Summary |
| Valuation: |
1997-12 |
| Grain: |
OYDY |
| Shape: |
(6, 6, 10, 10) |
| Index: |
[LOB] |
| Columns: |
[IncurLoss, CumPaidLoss, BulkLoss, EarnedPremDIR, EarnedPremCeded, EarnedPremNet] |
|
12 |
24 |
36 |
48 |
60 |
72 |
84 |
96 |
108 |
120 |
| 1988 |
5,934 |
47,258 |
95,054 |
131,616 |
165,117 |
181,937 |
198,395 |
206,068 |
213,374 |
217,239 |
| 1989 |
9,433 |
51,855 |
98,976 |
149,169 |
175,588 |
197,590 |
211,242 |
217,986 |
222,707 |
|
| 1990 |
11,996 |
54,742 |
118,964 |
163,695 |
190,391 |
213,972 |
225,199 |
235,717 |
|
|
| 1991 |
9,517 |
73,420 |
146,347 |
199,262 |
244,987 |
260,333 |
275,923 |
|
|
|
| 1992 |
12,479 |
78,212 |
157,400 |
209,959 |
244,018 |
267,007 |
|
|
|
|
| 1993 |
18,229 |
90,710 |
166,325 |
227,891 |
276,235 |
|
|
|
|
|
| 1994 |
14,952 |
94,303 |
186,577 |
252,449 |
|
|
|
|
|
|
| 1995 |
17,995 |
110,181 |
209,222 |
|
|
|
|
|
|
|
| 1996 |
20,390 |
107,474 |
|
|
|
|
|
|
|
|
| 1997 |
20,361 |
|
|
|
|
|
|
|
|
|

