Extrapolation Period Sensitivity#
import chainladder as cl
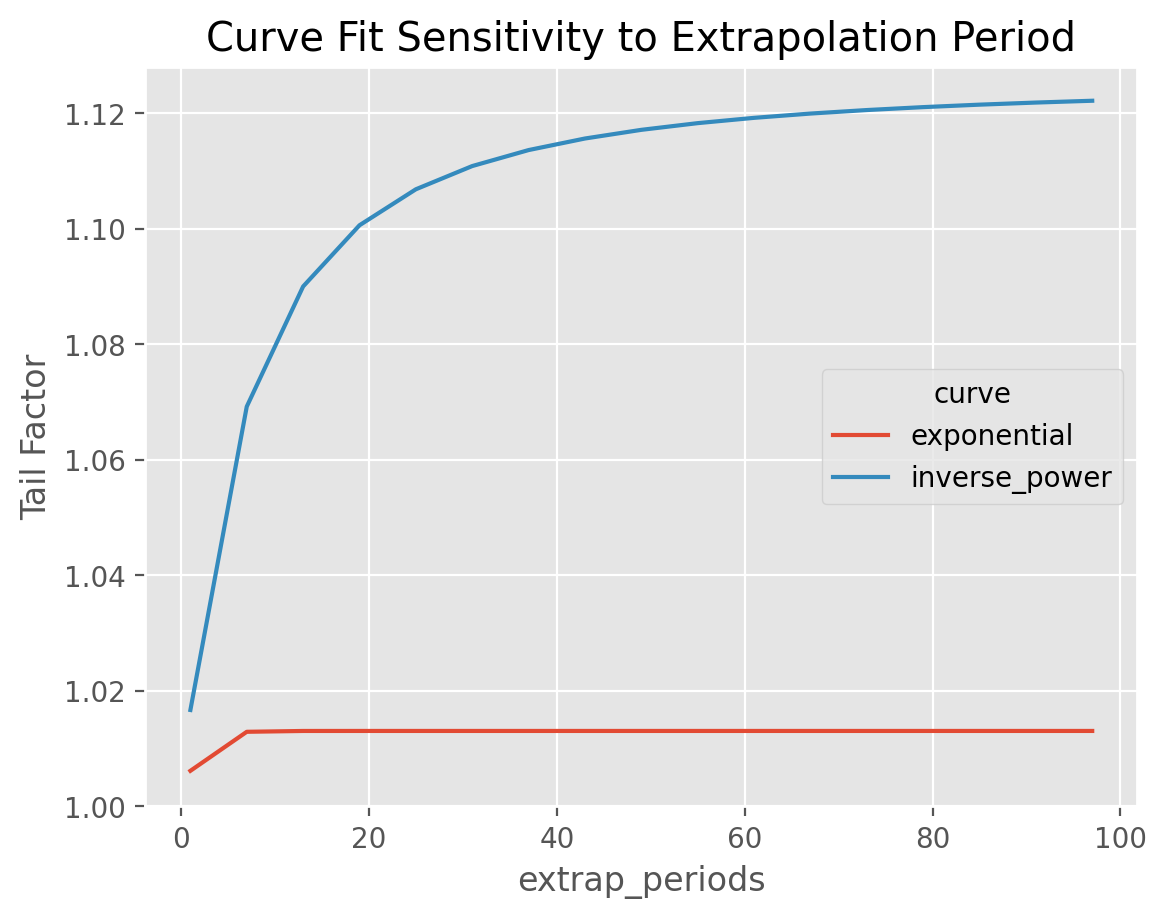
This example demonstrates the extrap_periods functionality of the TailCurve
estimator. The estimator defaults to extrapolating out 100 periods. However,
we can see that the “Inverse Power” curve fit doesn’t converge to its asymptotic
value.
tri = cl.load_sample('clrd').groupby('LOB').sum().loc['medmal', 'CumPaidLoss']

# Create a fuction to grab the scalar tail value.
def scoring(model):
    """ Scoring functions must return a scalar """
    return model.tail_.iloc[0, 0]

# Create a grid of scenarios
param_grid = dict(
    extrap_periods=list(range(1, 100, 6)),
    curve=['inverse_power', 'exponential'])

# Fit Grid
model = cl.GridSearch(cl.TailCurve(), param_grid=param_grid, scoring=scoring).fit(tri)

# Plot results
results = model.results_.pivot(columns='curve', index='extrap_periods', values='score')
Show code cell source
import matplotlib.pyplot as plt
plt.style.use('ggplot')
%config InlineBackend.figure_format = 'retina'

ax = results.plot(
    ylim=(1,None), ylabel='Tail Factor',
    title='Curve Fit Sensitivity to Extrapolation Period');