Clark Growth Curves#
import chainladder as cl
import numpy as np
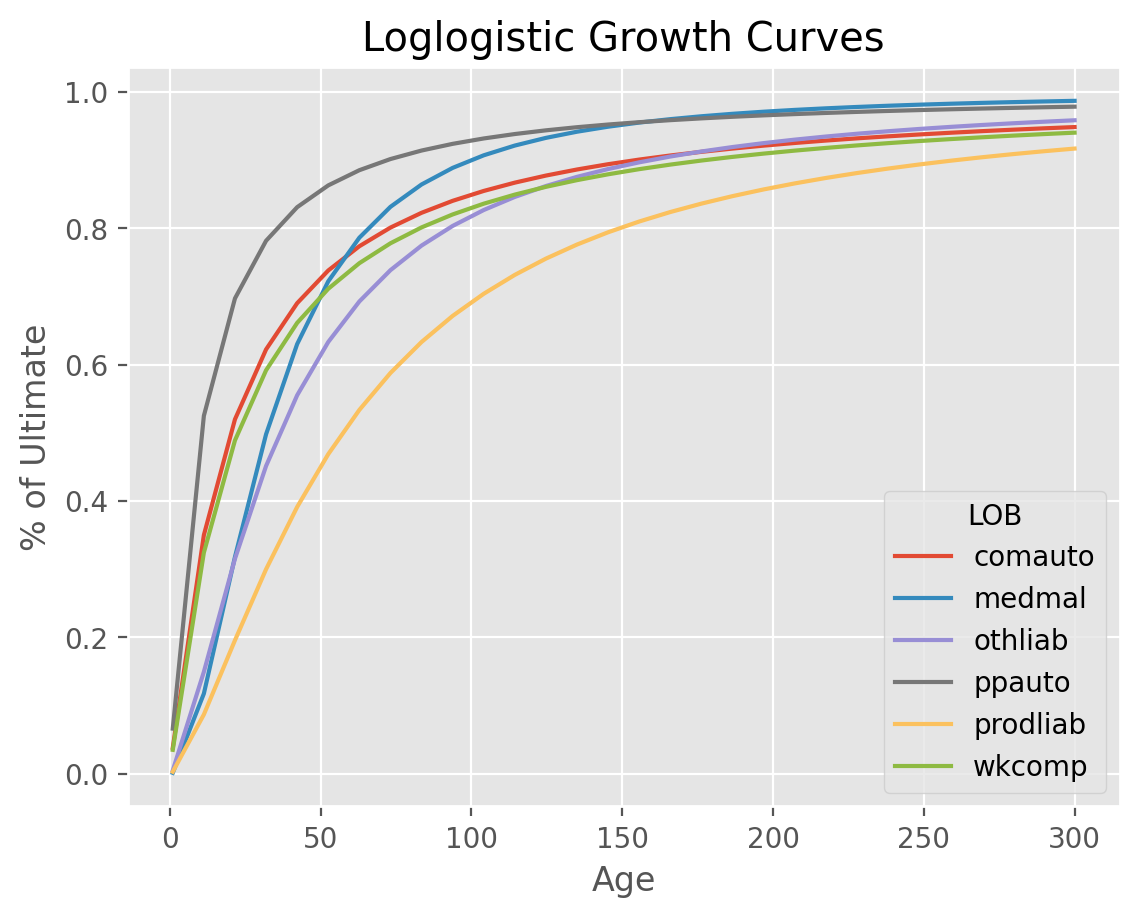
This example demonstrates one of the attributes of the :class:ClarkLDF. We can
use the growth curve G_ to estimate the percent of ultimate at any given
age.
# Grab Industry triangles
clrd = cl.load_sample('clrd').groupby('LOB').sum()

# Fit Clark Cape Cod method
model = cl.ClarkLDF(growth='loglogistic').fit(
    clrd['CumPaidLoss'],
    sample_weight=clrd['EarnedPremDIR'].latest_diagonal)

# sample ages
ages = np.linspace(1, 300, 30)

# Plot results
results = model.G_(ages).T
Show code cell source
import matplotlib.pyplot as plt
plt.style.use('ggplot')
%config InlineBackend.figure_format = 'retina'

ax = results.plot(
    title='Loglogistic Growth Curves',
    xlabel='Age', ylabel='% of Ultimate');