MunichAdjustment Basics

MunichAdjustment Basics#

import chainladder as cl
import pandas as pd

This example demonstrates how to adjust LDFs by the relationship between Paid and Incurred using the MunichAdjustment.

# Load data
mcl = cl.load_sample('mcl')

# Traditional Chainladder
cl_traditional = cl.Chainladder().fit(mcl).ultimate_

# Munich Adjustment
dev_munich = cl.MunichAdjustment(paid_to_incurred=('paid', 'incurred')).fit_transform(mcl)
cl_munich = cl.Chainladder().fit(dev_munich).ultimate_

plot1_data = cl_munich.to_frame().T.rename(
    {'incurred':'Ultimate Incurred', 'paid': 'Ultimate Paid'}, axis=1)

plot2_data = pd.concat(
    ((cl_munich['paid'] / cl_munich['incurred']).to_frame().rename(
        columns={'2261': 'Munich'}),
     (cl_traditional['paid'] / cl_traditional['incurred']).to_frame().rename(
         columns={'2261': 'Traditional'})), axis=1)

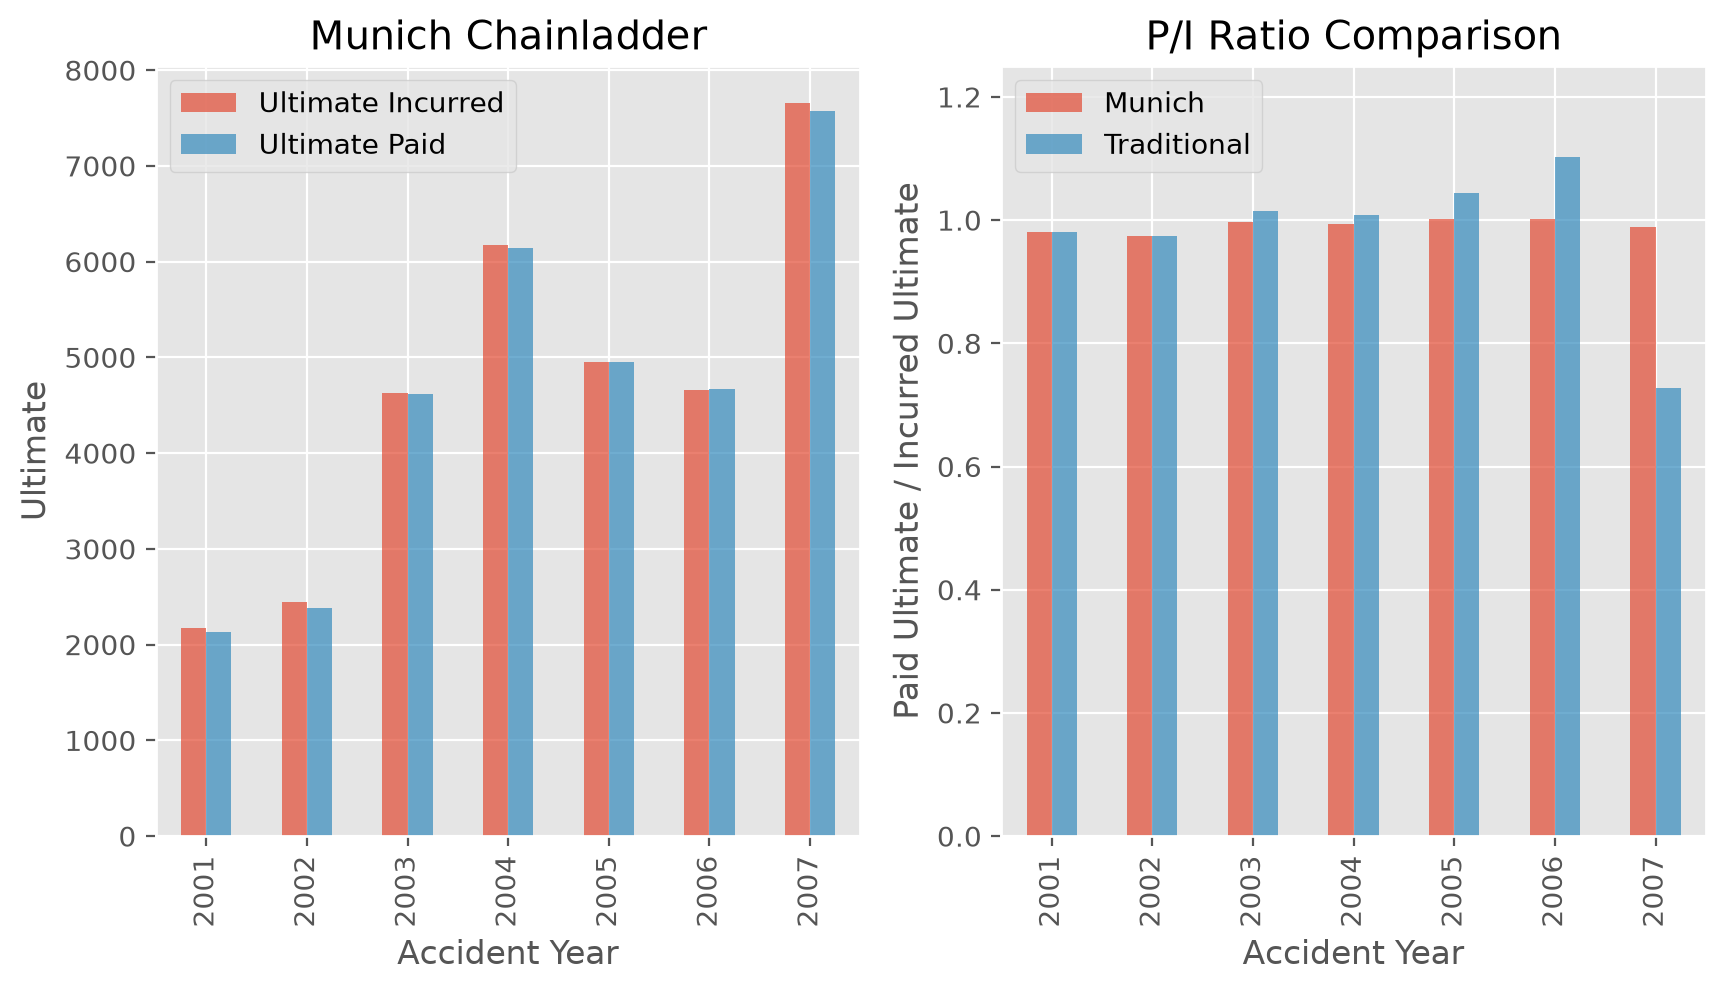
We can see how the Paid / Incurred Ultimates stay close to 1.0 for all origin periods under the MunichAdjustment while they diverge under the traditional Development.

Hide code cell source

import matplotlib.pyplot as plt
plt.style.use('ggplot')
%config InlineBackend.figure_format = 'retina'

# Plot data
fig, (ax0, ax1) = plt.subplots(ncols=2, sharex=True, figsize=(10,5))
plot_kw = dict(kind='bar', alpha=0.7)

plot1_data.plot(
    title='Munich Chainladder', ax=ax0, **plot_kw).set(
    ylabel='Ultimate', xlabel='Accident Year')
plot2_data.plot(
    title='P/I Ratio Comparison', ax=ax1, ylim=(0,1.25), **plot_kw).set(
    ylabel='Paid Ultimate / Incurred Ultimate', xlabel='Accident Year');
---------------------------------------------------------------------------
ValueError                                Traceback (most recent call last)
Cell In[3], line 12
      8 
      9 plot1_data.plot(
     10     title='Munich Chainladder', ax=ax0, **plot_kw).set(
     11     ylabel='Ultimate', xlabel='Accident Year')
---> 12 plot2_data.plot(
     13     title='P/I Ratio Comparison', ax=ax1, ylim=(0,1.25), **plot_kw).set(
     14     ylabel='Paid Ultimate / Incurred Ultimate', xlabel='Accident Year');

File ~/checkouts/readthedocs.org/user_builds/chainladder-python/envs/experimental/lib/python3.11/site-packages/pandas/plotting/_core.py:1185, in PlotAccessor.__call__(self, *args, **kwargs)
   1182             label_name = label_kw or data.columns
   1183             data.columns = label_name
-> 1185 return plot_backend.plot(data, kind=kind, **kwargs)

File ~/checkouts/readthedocs.org/user_builds/chainladder-python/envs/experimental/lib/python3.11/site-packages/pandas/plotting/_matplotlib/__init__.py:70, in plot(data, kind, **kwargs)
     68             ax = plt.gca()
     69         kwargs["ax"] = getattr(ax, "left_ax", ax)
---> 70 plot_obj = PLOT_CLASSES[kind](data, **kwargs)
     71 plot_obj.generate()
     72 plt.draw_if_interactive()

File ~/checkouts/readthedocs.org/user_builds/chainladder-python/envs/experimental/lib/python3.11/site-packages/pandas/plotting/_matplotlib/core.py:1877, in BarPlot.__init__(self, data, align, bottom, left, width, position, log, **kwargs)
   1873 MPLPlot.__init__(self, data, **kwargs)
   1875 if self._is_ts_plot():
   1876     self.tick_pos = np.array(
-> 1877         PeriodConverter.convert_from_freq(
   1878             self._get_xticks(),
   1879             data.index.freq,
   1880         )
   1881     )
   1882 else:
   1883     self.tick_pos = np.arange(len(data))

File ~/checkouts/readthedocs.org/user_builds/chainladder-python/envs/experimental/lib/python3.11/site-packages/pandas/plotting/_matplotlib/converter.py:245, in PeriodConverter.convert_from_freq(values, freq)
    243     values = [PeriodConverter._convert_1d(v, freq) for v in values]
    244 else:
--> 245     values = PeriodConverter._convert_1d(values, freq)
    246 return values

File ~/checkouts/readthedocs.org/user_builds/chainladder-python/envs/experimental/lib/python3.11/site-packages/pandas/plotting/_matplotlib/converter.py:273, in PeriodConverter._convert_1d(values, freq)
    271         return PeriodIndex(values, freq=freq).asi8
    272     elif isinstance(values, (list, tuple, np.ndarray)):
--> 273         return [_get_datevalue(x, freq) for x in values]
    274 return values

File ~/checkouts/readthedocs.org/user_builds/chainladder-python/envs/experimental/lib/python3.11/site-packages/pandas/plotting/_matplotlib/converter.py:273, in <listcomp>(.0)
    271         return PeriodIndex(values, freq=freq).asi8
    272     elif isinstance(values, (list, tuple, np.ndarray)):
--> 273         return [_get_datevalue(x, freq) for x in values]
    274 return values

File ~/checkouts/readthedocs.org/user_builds/chainladder-python/envs/experimental/lib/python3.11/site-packages/pandas/plotting/_matplotlib/converter.py:281, in _get_datevalue(date, freq)
    279     return date.asfreq(freq).ordinal
    280 elif isinstance(date, (str, datetime, pydt.date, np.datetime64)):
--> 281     return Period(date, freq).ordinal  # pyright: ignore[reportAttributeAccessIssue]
    282 elif is_integer(date) or is_float(date):
    283     return date

File pandas/_libs/tslibs/period.pyx:2987, in pandas._libs.tslibs.period.Period.__new__()
-> 2987 'Could not get source, probably due dynamically evaluated source code.'

File pandas/_libs/tslibs/period.pyx:1844, in pandas._libs.tslibs.period._Period._maybe_convert_freq()
-> 1844 'Could not get source, probably due dynamically evaluated source code.'

File pandas/_libs/tslibs/offsets.pyx:6382, in pandas._libs.tslibs.offsets.to_offset()
-> 6382 'Could not get source, probably due dynamically evaluated source code.'

ValueError: <YearBegin: month=1> is not supported as period frequency
../_images/6085685f0cc2631ae95f636c5a052a3b183484052a823c4874cde808325306a4.png