BootstrapODPSample Variability#
import chainladder as cl
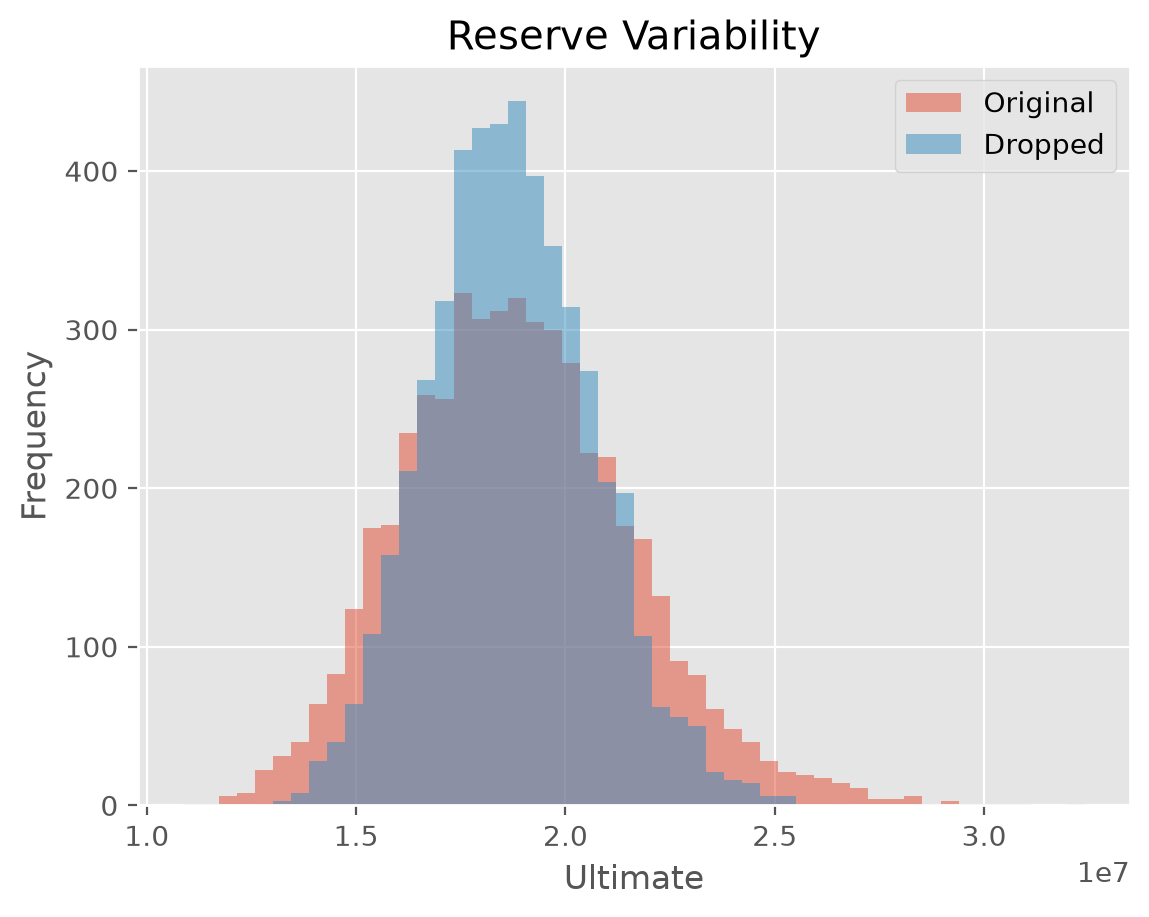
This example demonstrates how you can drop the outlier link ratios from the
BootstrapODPSample. This has a direct consquence of reducing reserve variability estimates.
# Load triangle
triangle = cl.load_sample('genins')

# Use bootstrap sampler to get resampled triangles
s1 = cl.BootstrapODPSample(
    n_sims=5000, random_state=42).fit(triangle).resampled_triangles_

## Alternatively use fit_transform() to access resampled triangles dropping
#  outlier link-ratios from resampler
s2 = cl.BootstrapODPSample(
    drop_high=[True] * 5+ [False] * 4,
    drop_low=[True] * 5 + [False] * 4,
    n_sims=5000, random_state=42).fit_transform(triangle)

# Summarize results of first model
results = cl.Chainladder().fit(s1).ibnr_.sum('origin').rename('columns', ['Original'])
# Add another column to triangle with second set of results.
results['Dropped'] = cl.Chainladder().fit(s2).ibnr_.sum('origin')
/home/docs/checkouts/readthedocs.org/user_builds/chainladder-python/envs/experimental/lib/python3.11/site-packages/chainladder/adjustments/bootstrap.py:311: UserWarning: 'where' used without 'out', expect unitialized memory in output. If this is intentional, use out=None.
  hat = xp.diagonal(xp.sqrt(xp.divide(1, abs(1 - hat), where=(1 - hat) != 0)))