Making Predictions#
import chainladder as cl
import pandas as pd
This example demonstrates how you can create development patterns at a
particular index grain and apply them to another.
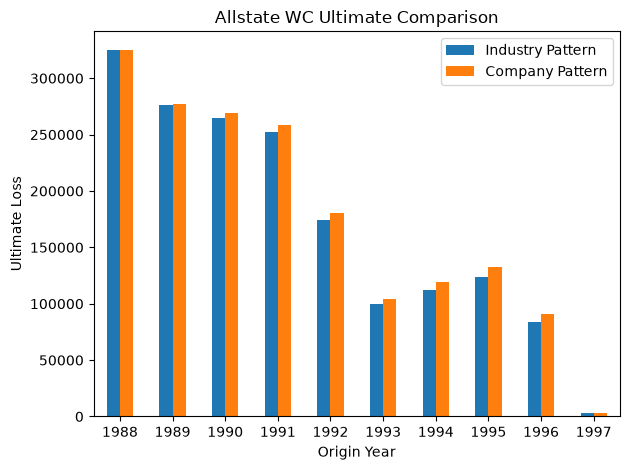
In this example, we can apply both an industry derived LDF or a company derived LDF to a specific triangle.
clrd = cl.load_sample('clrd')['CumPaidLoss']
clrd_wc = clrd[clrd['LOB'] == 'wkcomp']

industry_wc = clrd_wc.sum()

allstate_wc_industry_pattern = cl.Chainladder().fit(industry_wc).predict(clrd_wc.loc['Allstate Ins Co Grp']).ultimate_
allstate_wc_company_pattern = cl.Chainladder().fit(clrd_wc.loc['Allstate Ins Co Grp']).ultimate_

df = pd.DataFrame(
    {
        "allstate_wc_industry_pattern": allstate_wc_industry_pattern.to_frame(
        ).iloc[:, 0],
        "allstate_wc_company_pattern": allstate_wc_company_pattern.to_frame(
        ).iloc[:, 0],
    }
).fillna(0)
df.index = pd.to_datetime(df.index).year
df.index.name = "Origin Year"
df.reset_index()
| Origin Year | allstate_wc_industry_pattern | allstate_wc_company_pattern | |
|---|---|---|---|
| 0 | 1988 | 325322.000000 | 325322.000000 |
| 1 | 1989 | 276660.740492 | 276863.571154 |
| 2 | 1990 | 264559.787229 | 268960.552632 |
| 3 | 1991 | 252620.869201 | 258402.289056 |
| 4 | 1992 | 173864.635638 | 180150.887317 |
| 5 | 1993 | 99493.416499 | 104286.313106 |
| 6 | 1994 | 112350.433124 | 119003.414168 |
| 7 | 1995 | 123829.928837 | 132157.175486 |
| 8 | 1996 | 83778.038787 | 90947.646834 |
| 9 | 1997 | 2837.012601 | 3110.281691 |
import matplotlib.pyplot as plt

plot_df = df[[
    "allstate_wc_industry_pattern",
    "allstate_wc_company_pattern"
]].rename(columns={
    "allstate_wc_industry_pattern": "Industry Pattern",
    "allstate_wc_company_pattern": "Company Pattern"
})

# Create bar chart
plot_df.plot(kind='bar')

# Labels and title
plt.title("Allstate WC Ultimate Comparison")
plt.ylabel("Ultimate Loss")
plt.xticks(rotation=0)

plt.tight_layout()
plt.show()